
A new MapLight analysis of campaign finance records for Oakland found that local candidates raised more than $4 million over the past three election cycles - with the vast majority of funding coming from a fraction of the city's overall population. Ninety-three percent of contributions in the 2014 and 2016 elections combined came from less than 1 percent of the city’s population.
While most Americans believe money has too much influence in politics, these campaign contributions matter. Fourteen out of 18 races in the 2014 and 2016 Oakland elections went to the candidate who raised the most money. In 2016, local candidates raised $1 million, approximately $2 per city resident.
In each election cycle, direct contributions to candidates from a small set of donors outweighed public financing or independent expenditures. Although Oakland has a public financing system, public funds provided to candidates only totaled $300,000. In contrast, independent expenditures - spending to support or oppose a candidate that is not coordinated with the candidate’s campaign - added up to almost $700,000 to support Oakland candidates and less than $100,000 to oppose them.
Among direct contributions to candidates, over three-fourths came from individual donors. Political committees contributed 7 percent while small contributor committees, which are limited to receiving contributions of less than $200, gave less than 1 percent. Unitemized contributions, or those made by donors giving less than $100 to a candidate, also made up about 1 percent. Other organizations, which include companies and nonprofits gave nearly $600,000.
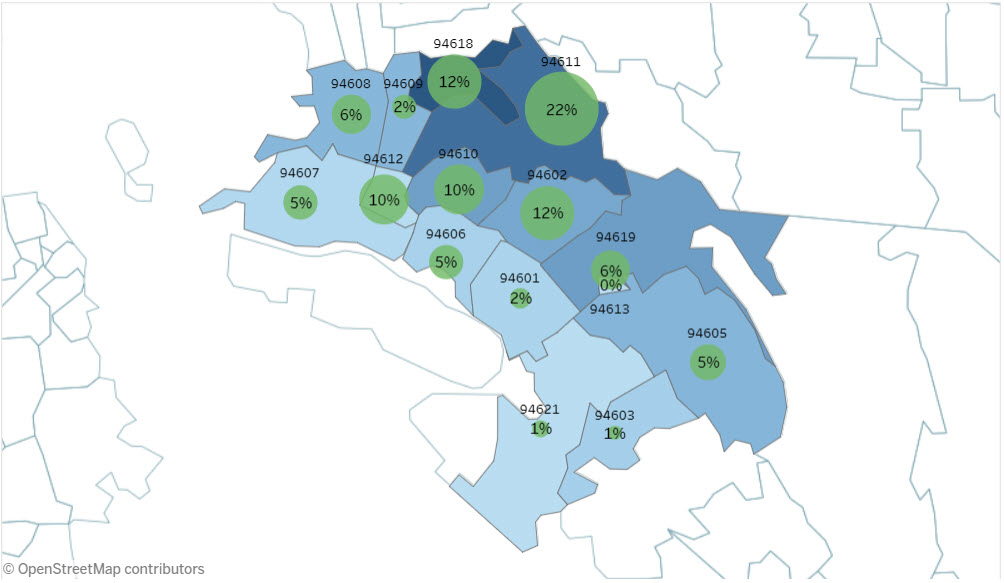
Oakland campaigns included a lot of money from outside the city. Nearly 40 percent came from other parts of California and 5 percent from out of state. Within the city, contributions are concentrated in wealthier parts of the city, particularly the Oakland Hills. Below, zip codes with higher median household incomes are in darker blue, and the amount of money contributed from each zip code is shown by the green circles.
Those wealthy neighborhoods also tend to have a higher proportion of white residents. Forty-six percent of contributions from the city of Oakland came from 4 majority white zip codes. Zip codes where over half of the population is white are shown in purple and areas where a minority of the population is white are shown in tan.

Although independent expenditures were not a large source of funds overall, MapLight also found that during the 2016 election, outside spending was concentrated in three Oakland school director races. In those contests, the amount of outside spending was greater than the amount of contributions given directly to candidates. Almost $300,000 was spent by outside spending groups to influence the election of the three school district directors in a race defined by debates on charter schools.
MapLight analysis of electronic campaign finance filings for the city of Oakland during the 2012, 2014, and 2016 election cycles. Contributions include itemized monetary and in-kind contributions to candidates for local office. Note that not all candidates filed electronically, especially in 2012; contributions filed on paper are not included. Population and median income figures from the U.S. Census Bureau.


